Friday, October 14, 2016

Electoral Math 10/14/16


Electoral Math 10/14/16

Today's biggest news is the a new Times-Picayune poll showed Hillary Clinton ahead by 6 in Iowa.  The poll itself was taken from 10/7-10/10 which puts it mostly in the timeframe between the Access Hollywood release and the 2nd debate, although there is one day after the debate.  I think this might generate a few more polls there over the next several days because the general consensus was that Iowa was the one state where Donald Trump had been performing quite well.  Additionally, the Times-Picayune put out a poll in Ohio during the same time frame that shows Clinton ahead by 5.  That's enough to move the Buckeye State into the barley Clinton column.  I currently have her ahead by 2.25% there.

I also have Clinton with very small leads in Arizona (1.07%) and Iowa (0.37%), although they are far too close to call or even consider leaning in 1 direction or the other, it would put Clinton at 358 EV in my projection.  To put it in a historical context, Barack Obama received 365 EV in 2008 against John McCain, but only 332 in 2012 against Mitt Romney.


Thursday, October 13, 2016

Electoral Math 10/13/16


Electoral Math Map 10/13/16

Here's my map for today.  As it stands right now, I've got Hillary Clinton with 322 electoral votes and Donald Trump with 187.  As has always been the case, the darkest shades of red or blue represented a lead of 10% or more, the medium shade represent 6-10% leads and the lightest colors 2-6% leads.  Only 2 states right now are toss-ups on my map, Arizona and Ohio, although currently, Clinton has a small lead in Ohio and Trump has a small lead in Arizona.  Including these EV, Clinton leads 340-198.

In my popular vote projection:
Clinton        59,877,478    46.64%
Trump         52,974,406    41.27%
Johnson       10,016,661     7.80%
Stein              3,991,788     3.11%

Sunday, October 28, 2012

Electoral Math 10/28/12


Electoral Math Projection:
Obama 277, Romney 206
No Toss-ups:
Obama 281, Romney 257
Minnesota changes from leaning to barely Obama today after a Mason-Dixon poll was released this morning showing Pres. Obama ahead by only 3. This is down from an 8 point Obama lead in the same poll 6 weeks ago. Overall my projection drops to a 5.5% advantage.
Based on my belief that we will not get enough post-debate polling to fully wash out older polls, I’ve looked at attempting to add the effect of the change in national polls to older data. This allows me to project out the state of the race in states today where polling data is sparse. It’s not a particularly elegant method to project the change in the electorate, but it’s as effective a method as I can quantify.
I haven’t yet updated the map to reflect this projection, however based on this effect, my popular vote projection stands at Obama 49.83%, Romney 48.73%. Even with this accounted for it still diverges fairly significantly from national polling data. What’s the difference? Primarily, it’s an issue of projection. Most national polls are limited (even daily trackers) to a couple thousand likely voters. Those voters are then extrapolated across the country using demographic information. While state polls do the same thing, there is less margin of error at the state level.
I tend to think that this projection is closer to the actual state of the electorate than my state poll only projection. We’ll find out soon enough.

Thursday, October 18, 2012

Electoral Math 10/18/12

Electoral Math Projection: Obama 277, Romney 206

No Leaners Projection: Obama 299, Romney 239

Ohio shifts back (albeit just barely) into Pres. Obama’s column after 2 new polls show leads between 1 and 3 points. This in addition to the aging out of an older poll that had Romney ahead by 1 moves my projection from O+1.8 to O+2.3%.

The other shift tonight comes in Virginia. While still a toss-up, the lead slightly shifts in my projection from Romney to Obama. Democrats should not get too excited thoug,h as the last 3 polls to come out in Virginia have all had Romney in the lead, while older polling that will age out of my projection in the next several days had fairly significant leads for Obama. Once these are removed (beginning on Saturday) VA will likely shift back, unless new polling puts Obama ahead by a significant margin.

Overall, it was a pretty good day for Obama in state polls, as there is some evidence of a small bump in his direction in statewide polling. However, most of this evidence comes from polls taken by Marist College which has tended to lean slightly in his direction throughout this season. National polling has been largely opposed this, where the current 7 day Gallup tracking poll shows Mitt Romney ahead by 7 today. This appears to be a bit of an outlier as well. Rasmussen’s 3-day tracker has Romney ahead by only 2.

Wednesday, October 17, 2012

Electoral Math 10/17/12


Projection: Obama 259, Romney 206
No-Toss Ups: Obama 286, Romney 252
6 EV are added back to Pres. Obama’s column after Nevada moves from toss-up too barely Obama after 2 new polls (Rasmussen, SurveyUSA) show the President ahead by 3.
One other color change tonight after a new Rasmussen poll in Montana shows Mitt Romney ahead by 8. This is in sharp contrast to their previous polls 2 months ago, when Romney was shown ahead by 17. As a result, Romney’s lead drop from 12 to 9 points and Montana is moved from safe to leaning Romney.
No other color changes tonight, although Romney continues to gain in my popular vote projection. Tonight, Romney picks up 0.27%, about 366,000 net votes and now trails by only 2.86%. That said, my popular vote projection is lagging considerably in states that are not likely to be close, because very little new polling is coming out of uncompetitive states. I feel much more comfortable about the projections in swing states where most of my projections are based solely on polls taken in the last 10 days or so.
Over the last several days it has become clear in swing states that some of the post-debate bump Romney had received was beginning to recede. Beginning with tomorrow’s polls we should see some results that are affected by post-presidential debate polling.

Saturday, October 13, 2012

Electoral Math 10/13/12


A new feature tonight for the toss-up states (Currently, NV, CO, OH, VA, NH). I’ve added a new color that looks at the current leader in my projections. As of right now, my official projection is Obama 253 EV, Romney 235 EV. However, when toss-ups are given to the current leader, the final tally becomes Obama 294, Romney 244. That said, it is very likely that Virginia will flip with any new polling that comes out, unless it shows a clear lead (> O+5).
Currently my toss-up state projections are:
Nevada: Obama 49.59%, Romney 48.21%. It is important to note that there has not been a single poll all year that has showed Mitt Romney in the lead. That said, the last 5 polls have all been between a tie and Obama +4.
Colorado: Romney 49.66%, Obama 48.70%. In the 5 polls since the debate (5 1/2 if the Gravis Marketing polls which took place both on the night of the debate and the night after), have been pretty widely scattered with ranges from R+4 to O+4. That said, 5 of the last 7 have shown Romney in the lead.
Ohio: Obama 49.88%, Romney 48.53%. Here there have been 8 polls in the last 9 days, with margins from O+6 to R+1. 6 of the 8 polls have been +1 on one side or the other, with both Romney & Obama ahead in 3 of those.
Virginia: Obama 49.54%, Romney 49.42%. Here there have been 6 polls since the debate, with Romney ahead in 4 of them, while Obama is ahead in the other 2. There’s been some divergenve in the polling here as well, as spread have been from O+5 to R+3. Here it looks like the CBS/NYT/Quinnipiac poll that has Obama ahead by 5 appears to be a bit of an outlier and as new data becomes available will likely switch the leader.
New Hampshire: Obama 49.68%, Romney 48.97%. There has only been 2 polls here since the debate with 1 a tie and the other a 4 point Romney lead. That said, polling data has been largely inconsistent here, as WMUR/Univ. of New Hampshire during the week of the debate (9/30-10/6) had Obama ahead by 6. It’s hard to know right now where the state of the race is exactly.
Overall, the gains continue for Mitt Romney although the pace has clearly slowed on the national level. The race is essentially stable since the immediate aftermath of last week’s debate. It remains to be seen (likely Monday) if the VP debate had any impact one way or the other (I expect it hasn’t). And even before we can detect a clear trend, the 2nd presidential debate will have taken place.

Thursday, October 11, 2012

Electoral Math 10/11/12


Another good day for Mitt Romney in my projection, as Barack Obama loses 18 EV in my projection. This represents the first time in months when Obama has not had leads accounting for at least the 270 EV needed to win the election.

In Ohio, Rasmussen & NBC/Wall St. Journal/Marist College released polls showing Obama ahead 48-47 and 51-45, respectively. While Obama has held leads in 5 of the 8 polls released since last week’s debate, my projectiong now shows his lead down to 1.5% and Ohio is moved into the toss-up category.

The upper midwest also had some color changes today. Both Michigan & Wisconsin were moved from leaning to barely Obama after new polls from Detroit News and Gravis Marketing released polls in Michigan showing relatively small leads than prior to the debate. The same holds true in Wisconsin where Rasmussen and CBS/NY Times/Quinnipiac University showed small leads for Obama as well. Right now the projection in both states is about 5 points, although in the 3 polls released in Wisconsin since last week’s debate have shown smaller leads than that.

The popular vote also showed a HUGE shift, primarily driven by a new SurveyUSA poll released in California, where Romney trails by only 14. In their last poll a month ago, Obama held a lead of 22.
The overall lead fell by a net 662,000 votes (0.47%) tonight, down to 3.21%. As I have been saying for days, this shift will take some time to roll through as more data becomes available.

There is considerable evidence now that Romney’s post-debate bump has leveled out. Most battleground states where there have been multiple polls in the last week are showing a much more stable race. That said, my popular vote projection has not caught up to the full state of the race. I believe based on all of the data that I have looked at we’re looking at a very close race, probably no more than a point or two nationally either way. A little stability (and a lot of polling data) will help move the popular vote projection along.

Wednesday, October 10, 2012

Electoral Math 10/10/12


Mitt Romney continues to gain in my projections, as Nevada is moved into the toss-up category, after 3 polls in the last week have shown Obama ahead by 1 in 2 of the polls and a tie in the third.

Additionally, New Hampshire is moved from leaning to barely Obama after Rasmussen released a poll showing a tie. That said, it’s actually down from Rasmussen’s last poll in NH (9/18) when Romney was shown ahead by 3.

Romney picks up 133,000 net votes tonight (0.10%) and has moved within 3.7% in tonight’s projection.

Based on post-debate polls, a case can be made that Romney is ahead (if even just slightly) in Florida, Virginia & Colorado. Even with these 3 states, Romney would only be at 257 EV. The path of least resistance to get to 270 runs through Ohio. 5 polls have been taken there since the debate showing Obama ahead in 3 and Romney ahead in the other 2. All of the polls are within the margin of error, with the range between Obama +4 and Romney +1. Using only these 5 polls, my Obama would be ahead by about 0.9%. As in 2004, Ohio looks very likely to be ground zero in the 2012 election.

Tuesday, October 9, 2012

Electoral Math 10/9/12


Mitt Romney picks up 15 EV (NC) in my projection tonight after Gravis Marketing released a poll today showing the challenger ahead by 9. This might be a bit of an outlier based on the post-debate data that has come out in the last few days, but Rasmussen had Romney ahead by 2 prior to the debate last week.

Also, Pennsylvania moves from leaning to barely Obama after polls by Susquehanna & Siena College are relased showing Obama’s lead down to 2 or 3 points. Based on this new data, the next poll would have to show a tie or Mitt Romney lead and the state would be moved into the toss-up category.

Most other polls today continue to show substantial gains for Romney since the debate, but nothing has really changed in the last few days. The election right now is very close; even closer than my projections right now.

In the popular vote, Mitt Romney picks up 550,000 net votes (0.41%) with today’s polls and cuts the lead in my projection down to 3.8%. I fully expect as more data becomes available, more states will begin moving toward Romney, as his gains have not yet fully been realized in my projections.

Monday, October 8, 2012

Electoral Math 10/8/12


No changes on the map tonight, although Mitt Romney picks up about 94,000 net votes in the popular vote count tonight.

A couple of interesting developments in national polls today. Rasmussen 3-day tracking poll came out a tie today. This is in contrast to yesterday’s release where Romney was ahead by 2. The implication is that there may be some softening in the effect of last week’s debate.

Further, in Gallup’s 7 day tracking poll, Obama is ahead by 5. Even more, Gallup released a 3-day result to show the effect of the debate. It too, was a tie, 47-47.

My take? I think we’re in a place where the race overall is too close to call. It will likely take about 2 weeks for my projections to catch up to the state of the race, even in battleground states. In states that are not expected to be close, it will likely be harder to predict than the correct margins than it was in 2008 because there will be fewer polls. The game changing event in 2008 was in late August vs. the beginning of October this year. Additionally, the race in 2008 was considerably more stable in September and October than this time around.

Sunday, October 7, 2012

Daily Tracking Polls

In Rasmussen's 3-day tracking poll release today, Mitt Romney leads Pres. Obama 49-47. This is the same result as yesterday. Today is the first day that all polling data was taken after Wednesday night's debate. This is in contrast to Thursday's release when Obama was up 2. My expectation today was that there would be an even further shift today.

In Gallup's 7-day tracker, Mitt Romney picked up 1% since the debate, now trailing Obama 49-46. This would mean that we should expect that by next Thursday's release (which will then be the first entirely post-debate poll), we should expect the race to be a point or 2 closer than this.

Yesterday, my expectation was that there was anywhere from a 6-10 point shift. Today it's only 3 or 4.

I'd like to talk about the math in the Rasmussen poll for a minute. Because there waas no change in today's 3-day poll vs. yesterday. It is safe to assume that within rounding error, yesterday's single day poll, was the same as Wednesday's single day poll. Since yesterday replaces Wednesday this is a safe assumption. That could mean 3 things. It could mean that Romney's post-debate peak has already passed. It could mean that there were polling anomalies either in the previous two days (not likely, with the confirming trend of state polls last week), or that yesterday was a bot of an outlier. Only time will tell if the gains Romney made in the last few days will stick. My gut is that they will. But instead of thinking that Romney could be ahead by a couple of points nationally, I'm now thinking it is much more of a dead heat.

Saturday, October 6, 2012

Electoral Math 10/6/12

Another day, another new toss-up state. Only 1 new poll was released today (Gravis Marketing) in Colorado. In it, Mitt Romney is ahead 49-46. This represents only the 2nd poll (out of 25) in this election cycle where he has held a lead here. In my projection, Obama still holds a small (0.3%) lead, but any new polling that confirms this result will likely flip the leader.
That’s not to say that it would go into the barely Romney column. It would take an extraordinary result for that to occur.
The map already looks significantly different that it did just 2 days ago. While Mitt Romney hasn’t picked up any EV in my projection just yet, Obama has lost 51EV in only 2 days and I expect that any new polls that come out in the next few days will likely swing even more states toward Romney, despite the good headline number on unemployment that came out yesterday. Wednesday night was a game changer.
As I mentioned on Thursday, state polls were going to be important, but almost just as important would be the Gallup & Rasmussen daily trackers. So far, Gallup’s tracker has moved 3 points, with only 2 of the 7 days worth of polling included in their tracker captured. Rasmussen has moved 4 points with 2 out of 3 days in their tracker poist-debate. The implication would be that the swing could be as wide as 6-10 points. It’s still a little too early to tell if this is true, but a few more days and a few more polls should prove out the hypothesis. If the swing is that wide, it would be enough to shift the election in Romney’s favor.

Friday, October 5, 2012

Electoral Math 10/5/12

Let the shift begin. 7 new polls in 4 states released today, causing Pres. Obama to lose 42 EV in my projection, with a 3rd state changing color toward the Mitt Romney.
In Florida, Rasmussen & WeAskAmerica released polls taken after the presidential debate showing Mitt Romney ahead by 2 & 3, respectively. This after a streak of 9 consecutive polls that showed Pres. Obama ahead. In my projection, Obama stays just barely ahead (49.9% - 49.4%), but it will only take one more poll with these types of results for Romney to shift into the lead. FLorida moves into the toss-up category.
In Virginia, Rasmussen & WeAskAmerica released polls that showed leads for Mitt Romney between 1 & 3 points. This after an even longer streak (12 polls) that favored Obama. Obama’s lead in my projection has shrunk down under 2 percent, and like Florida, would likely shift slightly into Romney’s favor if a couple more polls show similar results.
In Ohio, Rasmussen a new polls that showed Obama ahead by 1, while WeAskAmerica has Romney up 1. Here 14 consecutive polls showed Pres. Obama ahead. In my projection, Obama’s lead drops from 7 to 4%, and as a result, Ohio shifts from leaning to barely Obama. Similar to both FL & VA, more polling here could shift Ohio again to toss-up if these polls can be confirmed.
Finally, in Nevada, Gravis Marketing released a new poll that showed Obama ahead by only 1. Nevada has largely been up and down, or at the very least, been schizophrenic in its polling. 8 different polls have been released here in the last 3 weeks showing everything from a tie to an 11 point Obama lead. My projection currently shows Obama ahead by 5%.
As I expected yesterday, state polling appears to be swinging pretty quickly. That said, both Rasmussen & WeAskAmerica have tended to lean slightly toward Romney throughout the cycle. That’s not at all to say that their polling is suspect, nor do I think today’s polls will be refuted by future releases by other pollsters.
I expect that the race is considerably closer than my projection shows right now. There are two primary reasons: First, only statewide polls are considered, so only 4 states in my projection show any influence from the debate. Second, multiple polls (at least 3, depending on recentness) are considered when determining the projection in each state.
Mitt Romney picks up an astonishing 545,000 net votes (0.41%) and now trails by 4.34%. I expect as more polls become available, the race will get much closer.

Thursday, October 4, 2012

Electoral Math 10/4/12


A bunch of new polls so far this week, but essentially nothing changed. I’m looking forward to polls that could begin coming out as soon as tomorrow that show the after effects of last night’s debate.
It was clear to anyone who was paying attention that Mitt Romney had an outstanding night. He was the aggressor, he pushed around Jim Lehrer, and he was clearly in command. The next few days are going to be very interesting polling days.
There are a couple of key polls to look at. First, keep your eye out for the Gallup & Rasmussen daily tracking polls. Rasmussen’s tracker which looks at the last 3 days, will likely begin to move beginning with tomorrow’s release. By Saturday, it will be fully post-debate. This morning’s release currently shows Obama ahead by 2.
The Gallup tracker is a rolling 7 day tracker and will be slower to move, but presuming that there is some sort of shift after the debate, within a day or two a trend should develop that begins to move the numbers. It will take until next Thursday’s release before all data is after the debate. This morning’s Gallup release showed Obama ahead by 4.
Finally, I would expect that by no later than Monday or Tuesday there will be a substantial number of polls in what are being considered the swing states (NV, CO, IA, VA, FL, NH, OH, MI, WI) that should show any shift immediately.
That said, because my projections look at multiple polls over a relatively long time frame, my model will likely be a little slow to react to any diametric shifts that occur.

Monday, October 1, 2012

Electoral Math 10/1/12


10 new polls released today with 3 color changes on the map. First, in North Carolina, ARG released a new poll that shows Romney ahead by 4. With this new poll, North Carolina moves back to a tie in my projection, and is moved from barely Obama to toss-up.
In Michigan, WeAskAmerica released a poll showing Obama ahead by 52-40. Romney is up 2 points from their previous poll 10 days, and moves my projection from Obama by 10.5% to only 9.7%. Michigan is moved from safe to leaning Obama.
In New Hampshire, WMUR/UNH that appears to be an outlier. Obama is shown in the lead 54-39; a swing of 8 points from his previous high water mark just 5 days ago. Further, in a Rasmussen poll from 2 weeks ago, Romney was shown ahead by 3. In my projection, Obama moves ahead by 6.3% and moves from barely to leaning Obama. Look for New Hampshire to move back pretty quickly as new polling becomes available. I don’t expect this kind of lead can be confirmed.
Mitt Romney had a good polling day today. 3 new national polls showed Obama ahead by 2-3 points, while the daily tracking polls from Gallup (rolling 7 days) & Rasmussen (rolling 3 days) show Obama ahead by 4 & 3, respectively. Romney picks up about 130,000 net votes (.10%) today. Additionally, Obama’s loss of 15 EV in North Carolina might be a signal that he may have peaked last week and the race may begin a tightening trend.
Effects of the debate will not likely be seen in new polling until at the very earliest Friday or Saturday, and will likely take until early next week before any shifts from it are known.
I would expect that tomorrow & Wednesday will be relatively heavy poll release days, as pollsters & news organizations try to get a sense of the state of the race before the debate. I would also expect the late in the week will be relatively light until after new polls after the debate can begin on Thursday. It’s possible that this weekend and early into next will be very busy.
 

Sunday, September 30, 2012

Electoral Math 9/30/12 & Margin of Error


4 polls added today in IA, OH, MA & WA, with little impact on the map.
Today, I wanted to talk a little bit about margin of error. This morning, the Des Moines Register released a poll of 650 likely Iowa voters showing Obama in the lead 49 to 45 over Romney, with a margin of error of 3.8%. Most people would think that if that’s true then Obama’s lead is outside the margin of error. This is the great deception of polls.
What margin of error actually means is that with 95% confidence, it can be presumed that Barack Obama would receive somewhere between 45.2% and 52.8% of the vote in Iowa (+/- 3.8% on either side of the result). It can also be assumed, that Mitt Romney would receive between 41.2% and 48.8% of the vote. If this is true, then there are a considerable number of circumstances where Mitt Romney could be ahead. Certainly more than the “outside the margin of error” folks believe.
If we know that the 95% confidence level (+/- 3.8%) represents 2 standard deviations from the mean, then we can presume that 1 standard deviation is 1.9%. In a normal distribution, roughly 68% of outcomes are within 1 standard distribution, with 16% of the distribution more +1 SD and 16% less than -1 SD from the mean. If this is true, then we can presume that Mitt Romney has approximately a 15% chance of winning Iowa, if the election were held today, based on the results of this poll.
 

Friday, September 28, 2012

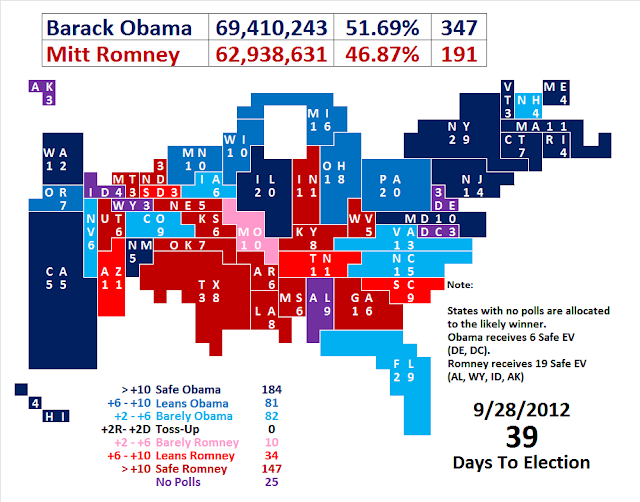
Electoral Math 9/28/12


5 new polls today, with 2 color changes on the map.

First, in New Hampshire, ARG released a new poll showing Obama ahead by 5. This is in contrast to a poll they released just 10 days ago, that showed the President ahead by only 1. With this new poll, his lead moves to just over 3 points in my projection, and New Hampshire moves from toss-up to Barely Obama.

In Michigan, Gravis Marketing released a poll that showed Pres. Obama ahead by only 4. With this new poll, his lead is cut from 11.8% to 9.8%; just enough to move Michigan from safe to leaning Obama.

In Virginia, ARG released a poll that shows Obama ahead by 2. It doesn’t change the map at all, but it does represent the 10th straight poll in Virginia, where je jas held a lead. The reason I bring this up is that several projections still consider Virginia to be a toss-up.

While the race there is close, (I have Obama ahead by 3.8%), for prognosticators to think that the state is too close to call it leaning in Obama’s favor, is at the very least overly cautious.

Overall, it was a mixed day for Romney. 4 EV were awarded to Obama in my projection tonight, but Romney picked up 36,000 net votes in my popular vote projection, cutting the lead from 4.84% to 4.82%, mostly on the back of the Michigan poll.

I expect polling will be light this weekend, but I’d like to spend some time talking about the misperception of margin of error.

Thursday, September 27, 2012

Electoral Math 9/27/12


9 new polls are added to the map today, in 9 different states result in 15 EV for Pres. Obama in my projection. Additionally, 2 other states changed in color today due to aging of some older polls.
In North Carolina, NBC/WSJ/Marist released a new poll showing Obama ahead by 2. This confirmation (which I had asked for yesterday) is in line with the last 3 polls taken there and moves Obama ahead by 2.8% in my projection. As a result, North Carolina moves from toss-up to barely Obama.
Michigan moved from leaning to safely Obama as a Baydoun-Foster poll taken 2 weeks ago that showed Obama ahead by only 2, and an MRG poll showing Obama ahead by 6 are aged out of my projection. The last 3 polls there show leads from 8-14 points.
Ohio is moved from barely to leaning Obama after a Rasmussen poll was aged out of my projection as well. There are 6 polls still included in my result, with an average result of Obama +6. In my projection, his lead is slightly larger than that, at 6.2%. I expect that this is only a temporary change, as any new poll where the margin is less than 6 will move the state back to barely on his side.
The remainder of the polls (Virginia, Nevada, New Hampshire, Iowa, Arizona, Connecticut, Indiana & Washington) were in line with previous polling and did not result in any color changes.
Overall, it was another strong day for Obama as he picked a net 343,000 votes today and expanded his lead from 4.59% to 4.84%.
I got 2 of my 3 wishes yesterday getting new polls in NC & NH. Still waiting for MO (any pollsters out there, hint! hint!)
With today’s map, it’s beginning to appear that the election is going to boil down to 7 states, (NV, CO, IA, VA, NC, FL & NH). Presuming that Obama wins all of the states where he currently leads by more than 6%, he would only have to 1 of the 6 that are not New Hampshire to win the election. Winning only New Hampshire would result in the dreaded electoral tie, but is an extremely unlikely outcome.

Wednesday, September 26, 2012

Electoral Math 9/26/12


Heavy day of polling, with 8 new polls in 7 states were released today, telling much the same story that polls had told for the last 2 weeks. Obama continues to gain ground overall.
No changes on the map today in electoral count, or in color, but Obama’s lead expands by about 40,000 votes from 4.56% to 4.59%.
Today’s polls showed considerable leads for Obama nearly across the board.
Florida, CBS/NYT/Quinnipiac: Obama 53, Romney 44
Ohio, CBS/NYT/Quinnipiac: Obama 53, Romney 43
Colorado, Gravis Marketing: Obama 50, Romney 46
Iowa, PPP (D): Obama 51, Romney 44
Pennsylvania, CBS/NYT/Quinnipiac: Obama 54, Romney 42
Pennsylvania, Franklin & Marshall: Obama 52, Romney 43
Massachusetts, Rasmussen: Obama 55, Romney 40
Maryland: Gonzales Research: Obama 55, Romney 36
I’d really like to get some more polling in 3 swing states that haven’t been polled much since the conventions. In Missouri, only Rasmussen has polled in September. In New Hampshire, there have been 3 different pollsters (Rasmussen, ARG & UNH) with vastly conflicting results ranging from Romney +3 to Obama +5. Clarity here would be nice. In North Carolina, there was a considerable amount of polling coming into and out of the Democratic Convention but none in the last 7 days. Right now in my projection NC is a tie (49.54% - 49.54%), although the last 3 polls show small leads for Obama.

Tuesday, September 25, 2012

Electoral Math 9/25/12

No changes on the map today, although 8 new polls in 6 states were released. The only real change on the map today is in the popular vote count, where Barack Obama's lead continues to expand ever so slightly by .1% or about 130,000 votes. I expect the next few weeks to be pretty busy, with more polls coming out daily throughout the remainder of the election cycle, so I'll be posting more as we get near the end of the campaign. 6 weeks from the election, there is a clear leader, despite the fact that national tracking polls seem to suggest that the race is closer than my projection. I'm not sure I buy it. The gap has been anywhere from 2-5 points for this entire election cycle.

Monday, September 24, 2012

Electoral Math 9/24/12

A host of new polls released today, with 1 change in EV as Iowa moves from toss-up to barely Obama after ARG released a new poll today showing Obama ahead by 7. This is in line with the NBC/Wall St. Journal/Marist poll from last week that showed him ahead by 8, but in stark contrast to Rasmussen's poll from last week that had Romney ahead by 7.

The other color change was in Pennsylvania where the Tribune Review/Susquehanna released a new poll showing the President ahead by only 2. This represents the closest Romney has been in a single poll since February, and a considerable outlier to 4 polls released in the last 2 weeks where Obama had leads from 6-12 points. As a result, Obama's lead in PA drops to about 8.7% and moves from Safe to Leans Obama.

The result: Obama picks up a net 75,000 votes today, with the gap now widening to 4.46% (up .05% from my last post on Saturday).

Saturday, September 22, 2012

Electoral Math

 
Today, I thought I’d show state by state what the electoral math actually looks like for the two candidates based on my projections. The list above is sorted by Mitt Romney’s margin of victory (or loss) by state, followed by the number EV for each state and the accumulated total EV for each state presuming states are won from top to bottom (or bottom to top in the case of Pres. Obama).
Presuming that Mitt Romney wins all of the states he currently has substantial leads in he will have 191 EV. He would then have to win 80 of the 100 EV available is states where Obama leads by 5% or less in my projections. Florida MUST be one of those states if we assume that all of the states where Obama leads by more than 5% are won by the president (247 EV).
The most likely scenario for Romey today would be for him to win NC, IA, NH, CO, FL, NV and VA. Ohio is also in play, although just barely with Obama having a 5 point lead. If Romney can capture Florida, he would only need to win Ohio and Virginia in order to get to 270. There are several other paths if he were to lose either of those states, but he can’t lose both. As Nate Silver put it if Obama wins Ohio and Virginia, the election is OHVA.

Friday, September 21, 2012

Electoral Math

The last week has shown some fairly significant movement on my map. Only 3 states are currently considered toss-ups on my map, with Pres. Obama ahead 322 EV to Gov. Romney’s 191 EV.
Further, Pres. Obama’s lead in the popular vote is now about 4.4% (nearly 6 million votes) at 51.5% to 47.1% for Romney.
As it stands right now, Romney would have to win all of the toss-up states (IA, NH, NC) plus pick of 53 of the 75 EV in states where Obama currently has leads between 2 and 6 points (FL, OH, VA, CO, NV) in order to get to 270 EV.
Conversely, Obama would only need to capture Florida, or he could lose Florida, win Ohio and any other of the states he has small leads in (NV, CO, VA) in order to win.
The map is certainly looking more daunting for Mitt Romney than it did a few weeks ago. Pennsylvania, Wisconsin & Michigan are starting to appear to be out of play 46 days from the election.
A link to my current map is below.
http://www.realclearpolitics.com/epolls/2012/president/obama_vs_romney_create_your_own_electoral_college_map.html

Saturday, July 28, 2012

Electoral Math


This week, there is no change in the electoral count on my map, although there are a few changes in color.
Nevada moves from leaning to barely Obama as a new Rasmussen poll released this week showed Pres. Obama ahead 50-45.  Their previous poll in April showed the lead at 8.  Currently in my projection, he’s ahead by 5.6% which is just enough to change color.

In Minnesota, Survey USA released a new poll that showed Pres. Obama ahead 46-40 in a likely voter poll, the previous poll in May which looks at registered voters showed the President by 14.  My projection moves down from Obama +15 to just under 10 (9.97%) and moves the North Star state from safe to leaning Obama.

In Wisconsin, Rasmussen released a new poll showing Obama ahead by only 3.  However, in Rasmussen’s previous poll in Mid-June showed Romney ahead by 3.  The replacement of this older poll, pushes Obama ahead by 6.3% and moves Wisconsin from barely to leaning Obama.
In Missouri, WeAskAmerica released a new poll showing Mitt Romney ahead by 9.  As a result, his lead grows from 5 to 6.8% and moves the state from barely to leaning Romney.

Overall, not much changed this week although polling continues to move slightly more favorable to Mitt Romney overall.  In my popular vote projection, Obama’s lead has been cut from 4.32% to 4.14%.  That said, the map is still daunting for Mitt Romney.

Based on my projections, and presuming that swing states are switched in order of current lead, Romney’s map is pretty difficult.  He would need to win the 6 states that are currently closest to his reach.  Ohio would be the game changer, but would require a shift of 4.7% to win.

North Carolina (15):        Romney +0.92%               Obama 297, Romney 206
Florida (29):                        Obama +0.65%                  Obama 297, Romney 235
Iowa (6):                              Obama +0.90%                  Obama 297, Romney 241
Virginia (13):                       Obama +2.54%                  Obama 284, Romney 254
Colorado (9):                      Obama +2.66%                  Obama 275, Romney 263
Ohio (18):                            Obama +4.69%                  Obama 257, Romney 281
Michigan (16):                   Obama +5.11%                  Obama 241, Romney 297
New Hampshire (4):       Obama +5.35%                  Obama 237, Romney 301
Nevada (6):                        Obama +5.58%                  Obama 231, Romney 307

Saturday, July 21, 2012

Electoral Math


With less than 4 months until the election, Barack Obama continues to hold a substantial electoral lead in the upcoming election.  That said, over the last couple of months, there has been some strength begin to develop on the Romney campaign that has begun to cut into the popular vote, which in my projection has fallen from a 5.3% lead for Obama, down to 4.3%.  Even still, over this time there has been little change in the overall dynamic of the race.  In fact, over this time Mitt Romney has had North Carolina (15 EV) move from barely in his camp into the toss-up category (although I still have him ahead by 1 in my projection). Conversely, Obama has only lost 6 EV in Iowa (although he still leads by 1 there as well).  There's also been a small shift in states with larger leads.  Below is the list of states that have changed color (or shade) since my last post in May.

State                   May                                 Today
Maine                Leans Obama                   Safe Obama
North Carolina  Barely Romney                Toss-Up
Georgia             Leans Romney                 Safe Romney
Michigan           Leans Obama                   Barely Obama
Iowa                  Barely Obama                  Toss-Up
Oregon              Barely Obama                  Leans Obama

Overall, 6 states haved changed color, 3 in each direction.

Despite the overall shift that has occurred in the election, the math is essentially the same as it was in 2008.  In fact, right now only Indiana and North Carolina would have a different result than the last election.  This leaves Mitt Romney with a limited number of paths that he can take to get to 270.  Essentially, he must carry the 3 tossup states (Iowa, North Carolina and Florida) and win 29 EV from the barely Obama states (CO, WI, MI, OH and VA).

Conisdering the 8 states that Romney must compete in there are 256 possible outcomes (2 to the 8th power).  Of these 256 combinations, Obama would win in 203 scenarios, Romney 49, and 4 electoral ties.  That doesn't necessarily imply that Obama has an 79% chance of winning (203/256) or that Romney has a 19% chance of winning (49/256), but it does mean that Romney has significant hurdles to overcome.  Strictly speaking Romney's chance would be lower is states where he is trailing because theoretically he has less than a 50% chance of winning those states.

Thursday, May 17, 2012

Electoral Math

A good number of new polls in the last week has changed colors in quite a few states and added 15 EV into Mitt Romney's column in North Carolina. 

The Tarheel State had two new polls released with diverging results.  PPP released a poll that showed Obama ahead by 1, while Rasmussen released a poll where Romney was shown ahead by 8.  Both polls were taken after the President's announcement supporting gay marriage and after North Carolina's vote against it.  The new polls put Romney ahead by 4 there and moves NC from Toss-Up to the Barely Romney column.

In Oregon, SurveyUSA released a new poll that shows Obama ahead by only 4.  This starkly contrasts their previous poll in March when he was shown ahead by 11.  SurveyUSA has been the only pollster to release a poll in OR so far this election season, but if this margin is accurate, I would expect other pollsters to head there soon to see if in fact that's the case.  For now, Oregon moves from Safe to Barely Obama.

In Colorado, there was a poll taken several weeks ago (4/23-4/27) by Purple Strategies that showed a dead heat at 47.  PPP's previous polling from April showed the president ahead by 13.  With this new poll added, the margin in my projection drops to about 4.5% and Colorado was moved from Safe to Barely Obama as well.

Several new polls in Wisconsin show the race tightening there as well.  Marquette, PPP and Rasmussen all released polls this week showing  anywhere from a 4 point lead for Obama to a tie and represents about a 10 point shift from polls taken in March and April.  In my projection, the lead is still 5, but even that is tenuous as any new polling will likely age out some older polls that showed with a more substantial lead.  For now, Wisconsin moves from Safe to Barely Obama, but it may be a toss-up before long.

Glengariff Group released a new poll in Michigan showing Obama ahead by 5.  That represents the third consecutive poll where the President's lead has been shown under 10.  With it, his overall lead in my projection drops from 11 to 8 and moves the Wolverine State from Safe to Leaning Obama.

Finally, in New Hampshire, PPP released a new poll showing Obama ahead by 12.  This is largely in line with WMUR/UNH's poll from April.  His overall lead moves from 5 to 8 in my projection and New Hampshire is moved from Barely to Leaning Obama.

Overall, a great week for Romney in polling as several close states are beginning to show a similar change to what is happening in national poll numbers where the race is much closer than my overall projection at this point.

I have last week's map pictured below for reference to show the shift versus the current map.  The reason, is that in contrasting these maps at this point is very important, because at this point in the election season, there is very little data to support projections.  In fact, 8 states and the Washington D.C. do not have any polling data yet.

As a result, state polls (which are running at about a 10 per week clip right now) are going to move my projection very slowly as I do not consider any national polling in my calculations.  As the election draws nearer and more states get polled more often, this becomes less of an issue, but for now, and likely the next several months, my map (in fact all electoral maps, regardless of the source) will lag significantly behind.  The important thing to look at in an individual week, is the overall direction of state polling data.

I discussed this phenomenon during the summer of 2008 as well here. http://electoralmath.blogspot.com/2008/07/week-in-review-polls-great-lagging.html

Overall, the map looks a lot different than it did a week ago.  The clean path to victory for Mitt Romney will be to sweep Florida, Virginia, Ohio.  If he were able to do that and win all the states he currently has leads in, he would be at 266 EV.  From there, any other currently Barely Obama state would give him the election.  It's still a pretty difficult, (at least for now), but the map looks a lot better for Romney right now.

Wednesday, May 9, 2012

Electoral Math

3 new polls today resulting in Iowa, Massachusetts and Ohio today, resulting in a color change on the map and 6 EV added to Pres. Obama's side.  Additionally, his lead expands by about 145,000 votes to 5.68% in my projection.

First, in Iowa, PPP released a new poll showing Barack Obama ahead by 10.  This is a substantial shift from the previous poll here by the Des Moines Register when Mitt Romney was shown ahead by 2.  As a result, Obama's lead expands from 1.9% to 3.6% and Iowa is moved from toss-up to barely on Obama's side.

In Massachusetts, Rasmussen released a new poll shoiwng Barack Obama ahead by 21.  This is in contrast to their last poll in April when he was ahead by only 11.  Massachusetts remains safely on Obama's side as his lead expands in my projection from 18 to 22 points.


In Ohio, PPP released a new poll showing Barack Obama ahead by 7.  It's a little on the high side of previous polls, but largely in line with the poll it is replacing (Fox News) in my projection.  Ohio remains barely on Obama's side.  Obama +5.

Friday, May 4, 2012

Electoral Math


Rasmussen released a new poll today in Montana showing Mitt Romney ahead of Barack Obama by 7 points.  This is largely in line with previous polls, although down a couple points from Rasmussen previous poll a month ago.  The new poll cuts into Mitt Romney's lead from about 7 1/2 down to about 6 1/2 points.  Montana remains Leaning Romney.  The popular vote remains nearly unchanged, although Obama does pick up about 9,000 votes in my projection.

Thursday, May 3, 2012

Electoral Math

5 new polls today in competitive states result in 4 color changes on the map, 3 in Mitt Romney's direction and 1 moving slightly toward Barack Obama.  With these new polls, Obama's lead in the popular vote is cut by about 600,000 votes or 0.46%. 

First in Florida, Quinnipiac released a new poll showing Mitt Romney ahead by 1.  This puts the last 3 polls in Romney's column, all within the last 10 days.  With this new poll and aging out of some previously taken polls changes the state in my projection from Obama +4 to Romney +1.  Florida moves from barely Obama to toss-up and 29 electoral votes are removed from Obama's column.

In Ohio, Quinnipiac released a new poll showing Obama ahead by 2.  This poll shows President Obama's smallest lead since a Fox News poll showed Mitt Romney ahead by 6 three months ago.  As a result, Obama's lead is cut from 7 to 5 in my projection and Ohio is moved from 7 to 5.  Ohio is changed from leaning to barely Obama.

In Arizona, Magellan Strategies released a new poll showing Mitt Romney ahead by 9.  This vastly contrasts the two most recent polls here by Arizona State University and the Behavior Research Center that both showed a statistical tie.  With this poll, Mitt Romney's lead expands from 5 to 7 and Arizona is moved from barely to leaning Romney.

In Pennsylvania, Quinnipiac released a new poll showing Obama ahead by 8.  Pennsylvania has been surprising underpolled thus far, for a state that is likely to be close on election day.  Only Quinnipiac and PPP have released polls there in the last 2 months.  Even Rasmussen hasn't released a poll here in nearly 3 months. As a result, Obama's lead expands ever so slightly from just under 6 to 7 and Pennsylvania is moved from barely to leaning Obama.

Finally, in Virginia, The Washington Post released a new poll showing Barack Obama ahead by 7.  Virginia remains essentially unchanged in my projection.  Obama +3.

It is worth noting that tracking polls in recent weeks have shown a trend swing toward Mitt Romney since the primary battle essentially ended.  That said, with as few state polls are currently being taken, it is going to take some time for my projection to reflect some of the current dynamics in the race.  As the election draws closer and state polls are less scarce, my map will react much quicker. 

It is also worth noting that I put myself out on a limb with some of my projections.  Most poll aggregators like myself use wider margins before they will call a state in one direction or another.  Generally, states that are within 5 or so points are considered toss-ups by others, but with the number of polls involved and the overall sample size from them, I find that there is enough evidence to support considerably smaller leads.  In order to get a similar picture to others simply consider the barely states as toss-ups and you'll see that my current projections are largely in line with most others.


Wednesday, May 2, 2012

Electoral Math


5 new polls get added to the map today in 5 likely competitive states (NC,VA,NV,MT and WI), two of which change color on my map today.  Of these, North Carolina moves into the toss-up column and 15 EV are taken away from Romney in my projection.  In the popular vote, Obama's lead expands from 5.90% up to 6.03%, after picking up about 180,000 votes in my projection.

First, in North Carolina, Survey USA released a new poll showing President Obama ahead by 4.  Polls have varied pretty widely here over the last several months showing as much as a 14 point swing from Obama +5 to Romney +9.  With this new poll, Mitt Romney's lead in my projection has been cut to just under 1% and North Carolina moves from barely Romney to toss-up.

In Virginia, PPP released a poll showing President Obama ahead by 8. This is in contrast to recent polls by Roanoke College and Rasmussen that showed Mitt Romney ahead here. As a result, Obama's lead expands from 3 to about 5 in my projection.
In Montana, PPP released a poll showing Mitt Romney ahead by only 5.  This is down from 9 in Rasmussen's poll last month and down from 10 in PPP's last poll here in November.  As a result, Mitt Romney's lead is cut from just over 10 down to about 8 and Montana swings from Safe to Leans Romney.

In Nevada, Rasmussen released a new poll showing Obama ahead by 8.  This is in line with PPP's poll from last month and up a couple of points from their previous poll about 6 weeks ago.  With this poll, Obama's lead basically unchanged.  Obama +8.


Finally, in Wisconsin, Marquette University released a new poll showing Pres. Obama ahead by 9.  While there hasn't been a poll here in nearly a month, it appears to be in line with previous results.  There is some evidence of a potentially expanding lead, as Marquette's last poll here in March showed Obama ahead by only 5.  I'm inclined to believe that Wisconsin will end up more competitive than current polls indicate, but for right now it's Obama +13.

Friday, April 27, 2012

Electoral Math


Today, Rasmussen released a new poll in Florida showing Mitt Romney ahead 46-45 over Barack Obama.  This is the first poll here in 3 months where the former Massachusetts Governor was shown in the lead.  That said, over the last 4 polls have shown a slow and steadt decline in Obama's lead.  In Rasmussen's poll 6 weeks ago, Obama was ahead by 3.  As a result, his lead is cut from 5 down to about 3.6%.  Florida remains barely in his column, but it would not be at all surprising if Florida moves back into the toss-up column before long.  Romney also moves closer in the total popular vote by about 136,000 in my projection and cuts into the President's overall lead from 6.00% to 5.90%.

Wednesday, April 25, 2012

Electoral Math


5 new polls get incorporated into my map today resulting in 3 color changes.  First, in New Hampshire WMUR/UNH released a poll Tuesday that shows Pres. Obama ahead here by 9.  This is in contrast to a Dartmouth poll taken a few weeks ago that showed Gov. Romney ahead by 2.  It does however fall in line with their previous polss (which admittedly is 3 months old when Obama was ahead by 10.  As a result of this poll, Pres. Obama's lead which I said in my previous polls was a very tenuous 7 points, down under the 6 point threshhold and moves New Hampshire from Leaning to Barely Obama.

In Texas, a new PPP poll was released showing Mitt Romney ahead by 7.  There have only been 2 polls in Texas this season so far, both of which were taken by PPP and had nearly identical results.  Texas remains unchanged as a result of this poll.  Romney +7.5.

In Arizona, 2 new polls were released showing the state a statistical dead heat.  Behavior Research Center released a poll showing Pres. Obama ahead by 2, 42-40.  Arizona State head the exact opposite result with Romney ahead 42-40.  As a result of these polls, Mitt Romney's lead in my projection drops to about 5 points and is currently being heavily influenced by Rasmussen's poll taken last month where Mitt Romney was shown ahead by 11.  Based on all the surrounding polls, this may be a bit of an outlier, but I'm still inclined to believe that Arizona is not quite as close as some of these polls might indicate.  Still, Arizona is moved from leaning to barely Romney.

In New Mexico, PPP released a new poll showing Pres. Obama by 14.  New Mexico remains basically unchanged as their previous poll taken in December showed the gap at 15.  New Mexico remains safely on Obama's side.  Obama +16.

Finally in Virginia, Rasmussen released a new poll showing Mitt Romney ahead by 1.  This is in stark contrast to a poll they took there just a month ago when Barack Obama was ahead by 9.  As a result of this poll, Virginia moves from leaning to barely Obama.  I would not at all be surprised if Virginia moves in to the toss-up with the nexy poll released there if these results are confirmed.  For now, I've got Obama +3, but a very tenuous 3 at that.

Thursday, April 19, 2012

Electoral Math

New polls today in 4 toss-up states (NH, OH, MO and FL) create 2 color changes on my map today.

In New Hampshire, Dartmouth released a poll showing Mitt Romney ahead by 2. The previous poll by WMUR and UNH taken at the end of January showed Pres. Obama ahead by 10. As a result, New Hampshire moves from Safe Obama to Leaning Obama. That said, it's probably closer than that there as the previous poll is likely an outlier. Obama +7 (but an extremely iffy +7 at that).

In Ohio, Fox News released a poll showing Pres. Obama ahead by 6. This falls largely in line with previous polls. That said, Fox News last poll in February had Mitt Romney ahead by 6 (which was likely an outlier at the time). My projection moves from Obama +7 to +9.

In Missouri, Rasmussen released a new poll showing Mitt Romney ahead by 3. Rasmussen's previous poll last month head Romney's lead at 9. As a result, Romney's lead is cut from 6 down to just over 2. Missouri moves from leaning Romney to barely Romney.

In Florida, Fox News released a new poll showing Pres. Obama ahead by 2. The last 6 polls taken here now show Pres. Obama ahead by leads ranging from 2 to 7 and ages out a Miami Herald/Mason-Dixon poll during the run up to the Florida Primary showing Mitt Romney ahead by 4. Overall, my projection moves from Obama +3 to Obama +5.

Wednesday, April 18, 2012

New York

Marist College released a new poll in New York showing President Obama ahead of Mitt Romney by 22.  This is largely in line with other recent polls here.  Mitt Romney closes the gap by about 15,000 with this new poll, but with a projected lead of more than 2,000,000 votes in my projection, New York is still one of the safest states on the map for Obama in this cycle.  No need to republish the map tonight.

Tuesday, April 17, 2012

Electoral Math

No changes in color on tonight's map after PPP released a new poll in Florida, but a slight bump (about 37,000 votes) in Barack Obama's lead in my current projection.  Still a long way until November.

Florida

PPP released a new poll in Florida today showing Barack Obama ahead by 5 in Florida.  This is largely in line with the most recent polls, and slightly expands his lead in my proection from 2 to 3 points.  That said, my current projection still includes the Miami Herald/Mason-Dixon poll taken during the Florida primary season that showed Mitt Romney ahead by 4.  Florida remains barely in Obama's column, but clearly Florida will be up for grabs in the fall.

Monday, April 16, 2012

Electoral Math

Now that the primary season is just about wrapped up, I thought I'd give a view of what the election looks like right now.  Based on where we are today, President Obama has a substantial lead in both the popular vote and the electoral vote.  First, there are still 9 states that do not have any polls in this election cycle.

For a moment (until there is polling data to validate it) I am going to assume that Barack Obama is going to win Delaware, Maryland and Washinton D.C., and that Mitt Romney will win Alabama, Oklahoma, North Dakota, Wyoming, Idaho and Alaska.

If this is true, then Obama has significant leads in states that represent 236 EV.  If it also holds true that Maine, Nevada and Ohio where current polling shows him ahead by 6-10 points, his total moves to 264.  This will mean that he would only have to win one of Pennsylvania, Virginia or Florida to win the election.

Conversely, Mitt Romney would have to win all the states where he currently has a lead, plus win PA, VA and FL to get him over 270 EV.  While the lead is currently significant, there is still 29 weeks before the election and anything can happen between now and then.

Right now, it appears President Obama has  clear lead on the map, but to coin a poker term, Mitt Romney certainly has an inside straight draw that would not require a giant switch in the electoral to win the election.